Your Annual Report Isn't a Spreadsheet. Stop Designing It Like One.
By Brittany Hill · June 30, 2026
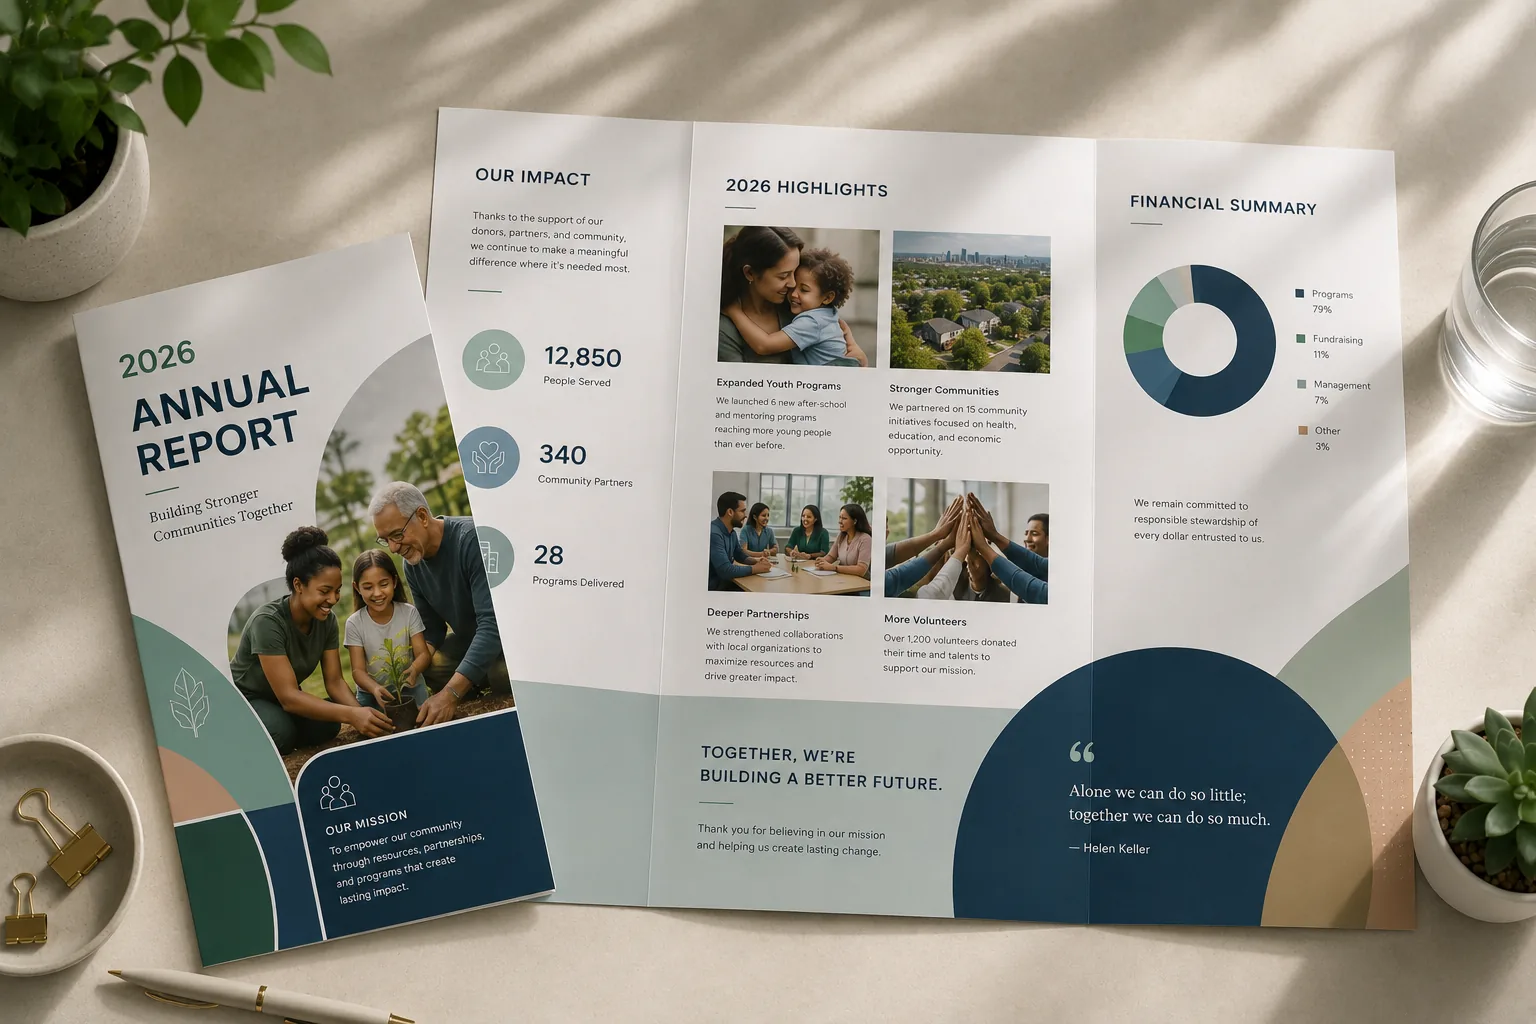
Let's be honest: nobody opens an annual report expecting a page-turner. That's exactly why yours should be one.
Whether you're reporting to investors, board members, donors, or the intern who has to file it, your annual report has one job beyond the numbers: prove you're worth paying attention to. Good design is what turns "here's our data" into "here's why it matters."
Done right, an annual report stops being a compliance chore and starts being one of the best pieces of marketing you'll produce all year.
Want a report people actually read? Check out our Graphic Design Services and see what strategic design can do for your next one.
Explore Branding Services →This Isn't a Box to Check. It's an Opportunity You're Sitting On.
Most organizations treat their annual report like a tax form — fill it out, hand it in, move on. Meanwhile, the smart ones treat it like prime real estate.
A well-designed report quietly does a lot of heavy lifting:
- 01Builds trust with the people who decide whether to keep funding, backing, or partnering with you
- 02Makes your fiscal responsibility and impact obvious, not buried
- 03Reinforces that you're a premium operation, not an afterthought
- 04Sets the stage for your next fundraise, pitch, or partnership conversation
- 05Actually gets read, shared, and remembered
This is often the single biggest showcase of your year's work. Don't let it die in a generic Word doc template.
Nobody Wants to Read a Spreadsheet. Give Them a Story Instead.
Budgets, KPIs, year-over-year metrics — on their own, this stuff is a nap in document form. Dump it on the page with no structure and you've lost your reader by page three.
Smart data visualization does the opposite. It helps your audience:
- 01Actually absorb what the numbers mean, fast
- 02Spot the wins without hunting for them
- 03Keep reading instead of skimming to the end
- 04Move through a 40-page report without wanting to quit halfway
This isn't about making things "pretty." It's about making your data impossible to ignore.
Numbers Don't Stick. Stories Do.
People remember stories. They don't remember spreadsheets. Pair your data with real photography, sharp infographics, and a layout with an actual point of view, and suddenly your report isn't a ledger — it's a narrative.
Instead of listing what happened, show what it meant. That's the difference between a report that gets skimmed and closed, and one that sticks with someone after they've put it down.
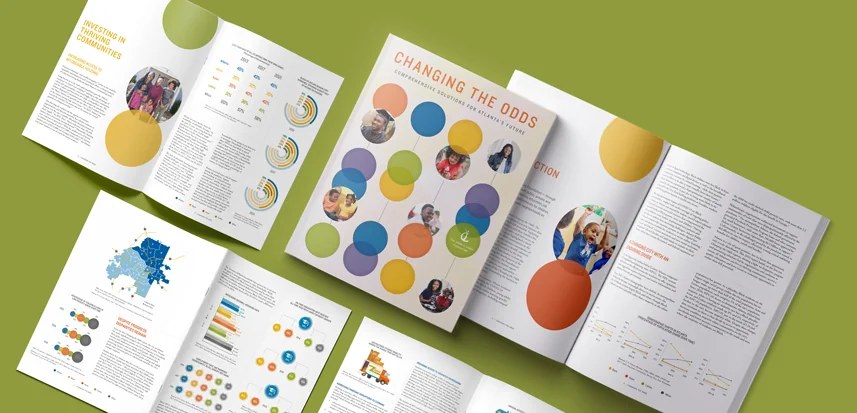
See it in action: browse our Case Studies to see how we've turned dense data into reports people actually remember.
View Case Studies →If It Doesn't Look Like You, It's Not Doing Its Job
Your annual report should feel like it belongs to your brand — not like it was built by a different company on a deadline. That means nailing:
- 01Typography: A type system that's readable and unmistakably yours.
- 02Color: Your actual brand palette, used correctly — not "close enough."
- 03Photography: Real, custom imagery. Stock photos scream "we didn't try."
- 04Layout: One consistent design language, cover to cover.
Every page either builds trust or chips away at it. There's no neutral option.
Accessible Design Isn't Optional Anymore
In 2026, if your report isn't accessible, it's not finished. That means designing for:
- 01Digital-first reading: Clean on mobile, clean on screen, clean as a PDF.
- 02Readable type: Sizing and spacing that works for assistive tech, not just designers' eyes.
- 03Real document structure: Proper heading tags and metadata so screen readers can actually navigate it.
- 04Contrast that works: Charts and graphs everyone can read, not just people with perfect vision.
This isn't a compliance checkbox. It's just better design — for everyone.
This Report Has a Longer Shelf Life Than You Think
A social post lives for a day. An annual report lives for years. It ends up in front of:
- 01New board members getting onboarded
- 02Grant reviewers and VCs doing due diligence
- 03Potential clients or merger partners sizing you up
- 04Reporters and press contacts looking for context
A report that's actually well-made keeps working for you long after publication — quietly building credibility every time someone new picks it up.
FAQ — Annual & Corporate Report Design
Why does professional annual report design actually matter?
Because nobody's impressed by raw data. Good design turns numbers into a story people understand, trust, and remember — which is the whole point of publishing the report in the first place.
Should our annual report match our website and brand?
Yes, completely. If it doesn't look and sound like you, it undermines everything else you've built. Same colors, same type, same voice — no exceptions.
Does good data visualization actually help with investor relations?
Yes. Investors are busy and skeptical. Clear charts and visual call-outs let them evaluate your numbers in seconds instead of digging through spreadsheets — and that speed builds confidence.
What should a modern annual report actually include?
At minimum: a real message from leadership, your key wins, data visualized (not just listed), transparent financials, original photography, and where you're headed next.
Strategy and Design Aren't Separate Steps
A great annual report isn't flipped through — it's experienced. When your data, your story, and your design are actually working together, the report stops being a formality and becomes one of your best assets of the year.
Ready to make a report people actually read? Stop burying your best year in a template built for someone else's brand. Let's build something that actually looks like the impact you made.
Talk to Elxel Creative →Continue Exploring
Service
BRANDING & DESIGN
From bold brand identities to custom graphics with personality, we combine strategy, creativity, and functionality to create designs that make people stop and pay attention. Whether you need a full brand refresh, custom graphics, or scroll-stopping animations, let us help bring your unique vision to life.
Case study
Edenbridge Pace
Edenbridge PACE is a healthcare and service support program dedicated to helping seniors in Washington, DC live with independence, dignity, and comprehensive care. When opening a new DC facility, Edenbridge partnered with us to develop a cohesive brand presence, custom website, and strategic marketing approach that felt clean, nurturing, and approachable.
Next step
Start a Project
Tell us what you need. We typically respond within one business day.
Let's build it
Start a Project
If this article sparked a next step, tell us what you need. We typically respond within one business day.